Author
ali.razmi

When we hear about “lazy ways” of doing things, we often associate them with inefficiencies and shortcuts. But what if there’s a lazy way that actually leads to a more productive workplace and improved business outcomes? Today, we’ll explore the Power BI add-in for PowerPoint—a powerful tool that elevates data storytelling in presentations.
We all understand the significance of visuals in presentations, as they help break down complex findings and allow the audience to grasp data easily. With the new PowerPoint add-in from Microsoft, seamlessly integrating live, interactive Power BI data into your presentations has never been easier. The best part is that your data will always remain up to date, providing real-time insights during your presentation.
Whether you’re starting from PowerPoint or Power BI, you have the freedom to add report pages or visuals to your presentations effortlessly.
- To use Power BI as your starting point, you must enable Power BI storytelling functionality for your organization. To turn this on:
- Head to the Export and sharing settings section of the Tenant Settings.
- Find the setting called “Enable Power BI add-in for PowerPoint.”
- Turn the switch on.
- Choose the scope of users the setting will affect under “Apply to.”
- Click “Apply” to save your changes.
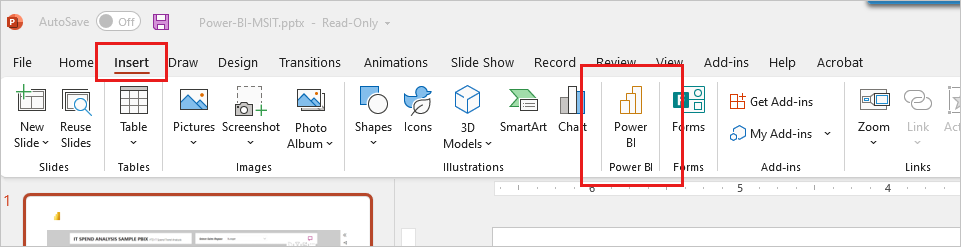
To add live Power BI data to PowerPoint, follow these instructions:
- Open the Power BI service and navigate to the report page containing the desired visual. Customize the visual’s appearance using filters, selections, slicers, or any other adjustments if needed.
- Right-click on the visual, or alternatively, click on “More options (…)”
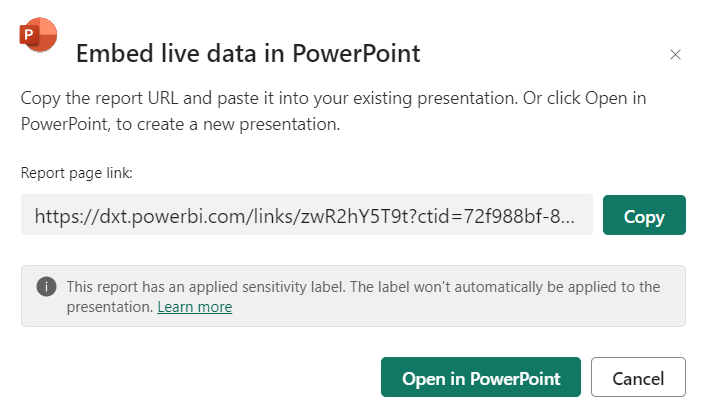
- If you’re adding the visual to an existing presentation, select “Link to selection” to obtain the visual’s URL. Copy the URL and then paste it into the Power BI PowerPoint add-in.
- For those who prefer to start a new presentation with the visual already loaded into the add-in, simply choose “Open in PowerPoint.”
- In the “Embed live data in PowerPoint” dialog that pops up, choose “Open in PowerPoint.” This action opens a new PowerPoint presentation with the selected visual already integrated into the add-in.
As you embark on your summer journey of presentations, remember these instructions for integrating live Power BI data and improving your Data Storytelling skills. Whether you’re lounging by the pool or sipping on a refreshing drink, let the magic of live data integration accompany you as your ultimate summer companion.