Author
Danielle

Power BI throughout the years
In 2006, Microsoft was exploring the idea of transforming data and how it could be used to enhance insights. Having been titled “Gemini”, this code-named project used SQL Server Analysis Services to create various reporting tools, as well as relational and multidimensional databases. 4 years later, the project was renamed “Power Pivot” and it became a powerful data analysis and data modeling add-in for Excel.
Then in 2012, to compete with other data visualization applications, Microsoft brought us “Power View” as an add-in for SharePoint. This was taken a step further in 2013 when Microsoft released “Data Explorer” as an add-in to Excel. Throughout the year they improved its capabilities and eventually renamed it “Power Query” (which was still only available as an Excel add-in).
By 2015, all the pieces for Power BI were in place! There were ways to arrange, visualize, and sort data. The final puzzle piece was creating a platform upon which reports could be built, distributed, and stored. This came in the form of Microsoft’s “Power BI Service”.
What is Power BI?
To understand what Power BI is, you must first understand what Business Intelligence (BI) tools are. BI tools can be generalized as a set of methodologies, processes, and technologies that transform raw data into meaningful and useful information. The goal is to provide the end user with insight into the data they started with.
Power BI is a cloud-based app that helps users consolidate, manage and analyze data. It can pull together data from a variety of sources to create engaging visuals, such as charts and graphs, all within a user-friendly interface. By feeding it company data, users can effortlessly run reports as Power BI works to clean up the data so that users can digest it easier, helping to surface insights.
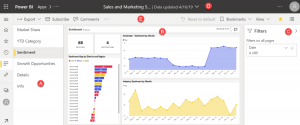
Photo courtesy of Microsoft
How is it different from Excel?
Power BI includes interactive experiences without any add-ins.
You can click on a data point and other visuals will respond to that click, highlighting or filtering relevant data. You can also show graphs & visuals that are difficult (or impossible) to reproduce in Excel, such as maps, pictures, and custom visuals.
Power BI is for uncovering insights.
Power BI is mainly for data analysis & storytelling. You can use Power BI for reporting and running analysis algorithms (clustering, outlier detection, geospatial patterns, etc.) Excel is more for number crunching and modeling. We can use Excel to create balance sheets and financial models, display a start-up business plan, and many other things.
Power BI works with large data sets.
You can connect to a business data set and analyze any volume of data. There is no artificial limit of rows in Power BI.
Share and read reports easily.
You can create reports in Power BI and share them in universal formats (i.e., browser pages or apps). This means that anyone can view your reports, without the use of Excel or Power BI.
How does Power BI help make your life easier?
Power BI facilitates strategic, tactical, and operational insights for decision-making. This allows users to generate and share snapshots of the state of their business with stakeholders internally. On top of that, Power BI is infused with machine learning. Its ability to spot trends and patterns helps users see what happened in the past, what’s happening in the present, and what may happen in the future.
This can reveal different perspectives on the state of the business and provide organizational improvements such as helping to mitigate expenses, identifying sales trends, and understanding customers. It isn’t just a tool to stay informed, it’s a tool to stay ahead and open to new opportunities.
Take John for example who is the Sales Manager of the team at his new start-up. John may use Power BI to analyze and comprehend the Sale team’s performance through tools such as the Sales Scorecard Dashboard. John would be able to determine who the top performers are, gain insights into the key performance indicators (KPIs), and even dig deeper into the sale trends within each region. This information will not only help John make swift and accurate decisions but also allow him to put more time and energy into the long-term success and goals of his company.
Here are some of its most popular uses:
- Predictive analytics
- Prescriptive analytics
- Performance analysis
- Ad Hoc analysis
- Decision support
- Reporting of KPIs

How it works:
First, raw data is correctly sourced.
Using the power of connectors, Power BI can work with simple data sources like Excel, or complicated data warehouses. Here, you can see the many sources of data Power BI connectors can access:
- Files (e.g. excel .xlsx, .pdf, .csv, .xml, .json)
- Data Bases (e.g. MS SQL, Oracle, SAP HANA, PostgreSQL, MySQL, Amazon Redshift, Snowflake, and others)
- Folders (cloud-based e.g. SharePoint and locally-based)
- Azure Services (Azure SQL Database, Azure Blob Storage, Azure Data Lake, others)
- Online Services (e.g. Microsoft Exchange, Dynamics 365, Salesforce Objects, Google Analytics)
- Other Sources (e.g. websites, OData feed, ODBC, Active Directory, others)
- Indirect connection via other services (e.g. Microsoft Azure Data Factory)
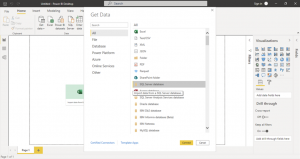
Photo courtesy of Microsoft
Once the data is sourced, it’s time to process it.
Power Query is meant for data processing, and we can use it to combine data from different places. It allows you to derive new columns of data, format and remove data, and reshape data (grouping, pivoting, transposing). You can even write formulas to do advanced data manipulation. Power Query lets users focus on the data without worrying about things like cleaning or missing data.
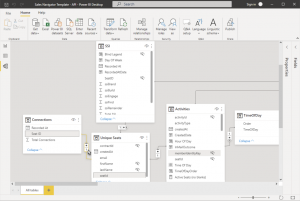
Photo courtesy of Microsoft
Finally, it can be transformed into information.
The final step is to analyze your data. Using Power BI’s rich visualization capabilities, users can transform their data to provide insight and takeaways. This brings us to the next section, where you can visualize your data.
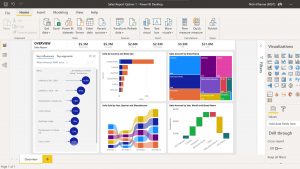
Photo courtesy of Microsoft
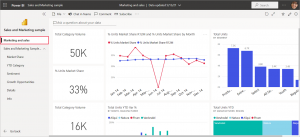
Photo courtesy of Microsoft
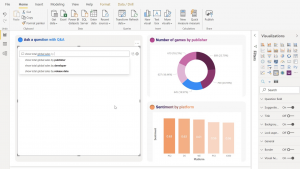
Photo courtesy of Microsoft
Where can you find Power BI?
Here we can find how power BI and how can be used on different platforms.
Power BI desktop
The Power BI desktop is the most complex and complete of all the versions. Built with interactive visualizations and data modelling, it’s an analyst’s best friend. It allows you to connect to and process data from various sources, automatically detecting relationships between tables to create additional insights. You can then create dynamic reports in the Report View, where you can add filters, select fields, and format your reports with colors, gradients, etc… oh, and the basic license is free.
Power BI service
The Power BI service is a cloud version of Power BI. Although not as complex as its desktop counterpart, Power BI Service lets users get pre-processed data and prepare reports. These reports can then be transferred between desktop and cloud versions, as well as sent to Power BI Mobile.
Power BI mobile
The Power BI mobile is a version built for convenient access to reports. Users can analyze reports at any time and any place from their tablets and smartphones.
Licensing and recommendations
Power BI Desktop / Free license
This license is perfect for users beginning their Power BI journey. It’s also practical for individuals looking to analyze data for personal reasons, or for small businesses that don’t need to share reports with employees via cloud services.
- Analyze and create reports
- Publish and store 1GB worth of reports to My Workspace
- Users can’t share or view other people’s content
- License cost: free
Power BI Pro
This license enables collaboration between users. It’s best suited for small and medium businesses, as they don’t require as much storage due to the lower number of users. Large organizations looking to test Power BI can also choose this option to run a pilot project.
- Users can collaborate on reports with other Pro license users
- Publish reports with shared capacity (up to 10GB per user).
- Schedule dataset refreshes up to 8 times a day.
- License cost: $ 9.99 per user/month
Power BI Premium per user
This solution is best suited for companies with a limited number of employees (or a limited number of analysts and decision-makers) that process and consume lots of data in a short period, and require immediate access to the information.
- This license combines the advantages of Power BI Pro (licensing per user) and Premium (larger data models, AI, paginated reports).
- A user can collaborate with other users on reports published to a shared capacity (up to 100GB per user).
- A user can schedule a dataset refresh up to 48 times a day.
- License cost: $ 20 per user/month
Power BI Premium
This subscription–not a license–is for large organizations requiring the highest capacity and processing power available. It allows Power BI Desktop (free license) users to cooperate with Power BI Pro license users, and thanks to the increased processing power, users can work more efficiently.
- Assigned to the entire organization.
- the organization receives a dedicated Premium capacity with up to 100 TB of storage and 8 v-cores for optimal processing power.
- Up to 48 scheduled refreshes of a dataset a day
- Power BI Desktop (free license) users get the possibility to view and analyze the reports published by Pro license users.
- License cost: $4,995 per organization/month
Creating meaningful reports can be a challenge, and users often struggle to get past the hurdle of selecting the most important data, never mind actually working with it. Power BI makes reporting simple through its intuitive interface, enabling you to generate meaningful reports without the hassle of sifting through your data. With the ability to spot past, present, and future trends, Power BI is like a window into the state of your business. Spot those green lights and red flags to help you advance and stay one step ahead of your competition.